Posts

Showing posts from June, 2022

Visualizing Data Part - 1

Image
  Let's talk about features, how can they be visualized. Do you remember Cartesian plane we studied in our school days? Am pretty sure  you do.  A simple plane or space where we can represent our data. Consider a Cartesian plane having x axis and y axis .Now if we plot a data as (3,4) then we are aware that 3 is nothing but 3 units towards x axis from origin and  4 represents 4 units towards y axis from origin. And this point (3,4) is nothing but a scalar term so we used cartesian plane. But in ML we deal with features as a vectors so we need to know Vector Space. And if you know Cartesian Plane  then Vector Space/Plane is simply the same but with high dimensions representations capability.   Okay now that we are cleared with terminologies let's move forward. Consider that you have been given a task of classifying girls and boys on the basis of height of few students given to you . So we can intuitively say that girls have a somewhat shorter height th...

Classification and Regression

Image
     It's a summer break and your teacher has given you a project which is to be submitted as school reopens.And as usual you won't touch the project  until your vacation is about to end.Don't worry I was the same kind of guy. You open your diary where the project details were written and was amazed to see that you have to do two sub tasks for your project . Your teacher has given you data of about 50 people with their heights (in meters) and weights (in kgs) and first task is to find Body Mass Index and second task is to divide those 50 people into groups of    Underweight,   Healthy weight,  Overweight and  Obesity. You google,  what is BMI and how to calculate it and you find :

Normal Distributions

Image
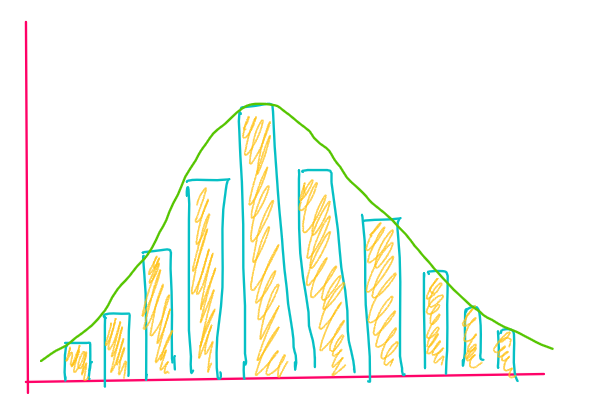
 For a long time ,I always wondered what those crazy looking curves actually meant ,what were its significance ,it's applications. Today let's figure it out . Distributions are important because just by looking at the shape of distribution formed by the data ,one can draw a lot of insights without even actually going through the data . A distribution is simply a collection of data, or scores, on a variable. Usually, these scores are arranged in order from smallest to largest and then they can be presented graphically.                                         — Page 6,  Statistics in Plain English , Third Edition, 2010. Gaussian / Normal  Distribution: Have you ever wondered why all new born babies are "almost" of same heights if not exactly ?? Yes there may be exceptions where a baby is somewhat taller or dwarf than rest. Also have you ever wondered why m...