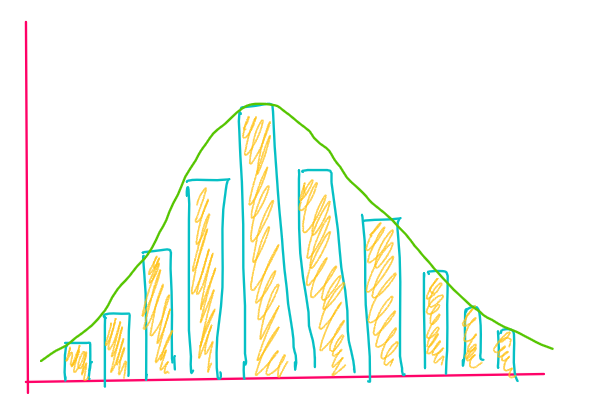
For a long time ,I always wondered what those crazy looking curves actually meant ,what were its significance ,it's applications. Today let's figure it out .
Distributions are important because just by looking at the shape of distribution formed by the data ,one can draw a lot of insights without even actually going through the data .
A distribution is simply a collection of data, or scores, on a variable. Usually, these scores are arranged in order from smallest to largest and then they can be presented graphically.
— Page 6, Statistics in Plain English, Third Edition, 2010.
Gaussian / Normal Distribution:
Have you ever wondered why all new born babies are "almost" of same heights if not exactly ?? Yes there may be exceptions where a baby is somewhat taller or dwarf than rest. Also have you ever wondered why most of the students in a class are roughly of same height ,and very few will be extreme tall or dwarf ? Did you ever thought why in any given exams many students gets grade A and B , very few get A+ and C. If not, no worry ,I also never wondered ?? But let's talk about it now.
Normal Distribution is defined by following equation.
Do not worry by this crazy looking equation , it can simply be represented by exponential of some squared term which we have already studied sometime in past.
 |
Image by Author
|
As we can see in the figure it becomes very much obvious why Normal Distribution is often called Bell Curve ,because it looks as bell. On the y axis we can see the probability where "More Likely " lies near 1 and "Less Likely " lies near 0 . Reminder probability lies between 0 and 1. Most of the data tend to cluster around the center value and further the value is away from center ,less likely it is to occur.
Let's go with an example below , here we can see two distribution one is of Babies heights and other is of Students heights in a class. It is very much evident that babies height is lesser as well as all babies are almost of same sizes therefore the distribution is very much peaked around value 20 inches.
Whereas in a class of student we can find students with different heights mostly of same heights around 70 inches and correspondingly less students who are taller or shorter.
 |
| Original Image by StatQuest with Josh Starmer |
The mean value of the babies is 20 inches whereas that of students is 70 inches. As we can see from the image ,we can infer that the Normal Distribution is always centered at mean value
Variance is the spread of the data that is how data is spread around the mean.
We generally don't talk about variance because it doesn't hold the unit as that of mean so we cannot plot both the value over same curve. By saying that they don't have same units, what I meant is let's say we found mean of height of students as 180 cm ,but after finding it's variance ,as there is a square term in its formula , it's unit will become cm squared ,so we cannot plot them over same plot
The width of the curve formed by yellow rectangle shown in the figure is defined by standard deviation .Standard deviation is important parameter because normal distribution is drawn such that around 68% of measurements falls between +/- 1 standard deviation ,95% of measurements falls between +/- 2 standard deviation and 99.7% measurements falls between +/- 3 standard deviation .
Standard deviation is the square root of Variation and therefore is mostly used with the mean as they both have same unit.
 |
| Wikipedia |
Remember that spread of the curve determines how tall the curve can be ,that is if curve has high spread ,it will be shorter , if curve has less spread then it will be taller.
Real Life Applications:
- Measurement errors in physical experiments are often modeled by a normal distribution.
- Many scores are derived from the normal distribution, including percentile ranks ("percentiles" or "quantiles")
- In hydrology the distribution of long duration river discharge or rainfall, e.g. monthly and yearly totals, is often thought to be practically normal
- In standardized testing, results can be made to have a normal distribution by either selecting the number and difficulty of questions or transforming the raw test scores into "output" scores by fitting them to the normal distribution.
Take Away points:
- Normal Distribution has two parameters mean and standard deviation
- It is centered around mean
- 68% of measurements falls between +/- 1 standard deviation
- 95% of measurements falls between +/- 2 standard deviation
- 99.7% of the data falls in the range of +/- 3 standard deviation
References:


Comments
Post a Comment